Overview:
Due to the recent COVID outbreak and as it continues to spread throughout the world, employees are being to asked to work from home. While most of the companies are already getting adapted to this new way of working, there are mixed opinions among employees from different parts of the world. IMO , Working from home is a good option for new parents, people with disabilities and others who aren’t well served by a traditional office setup. As this was appreciated by most of my colleagues and industry friends, i wanted to see how everyone is reacting to this new way of working across the world. In this post, i will explain how i built an application in 10 minutes to solve this particular question in mind using server less computing offered by Azure.
PreRequisities:
You will need to have an Azure Subscription. If you do not have an Azure subscription you can simply create one with free trial.
Services used:
- Azure Logic Apps
- Azure Functions
- Azure CosmosDB
- Cognitive Service
- PowerBI
Architecture:

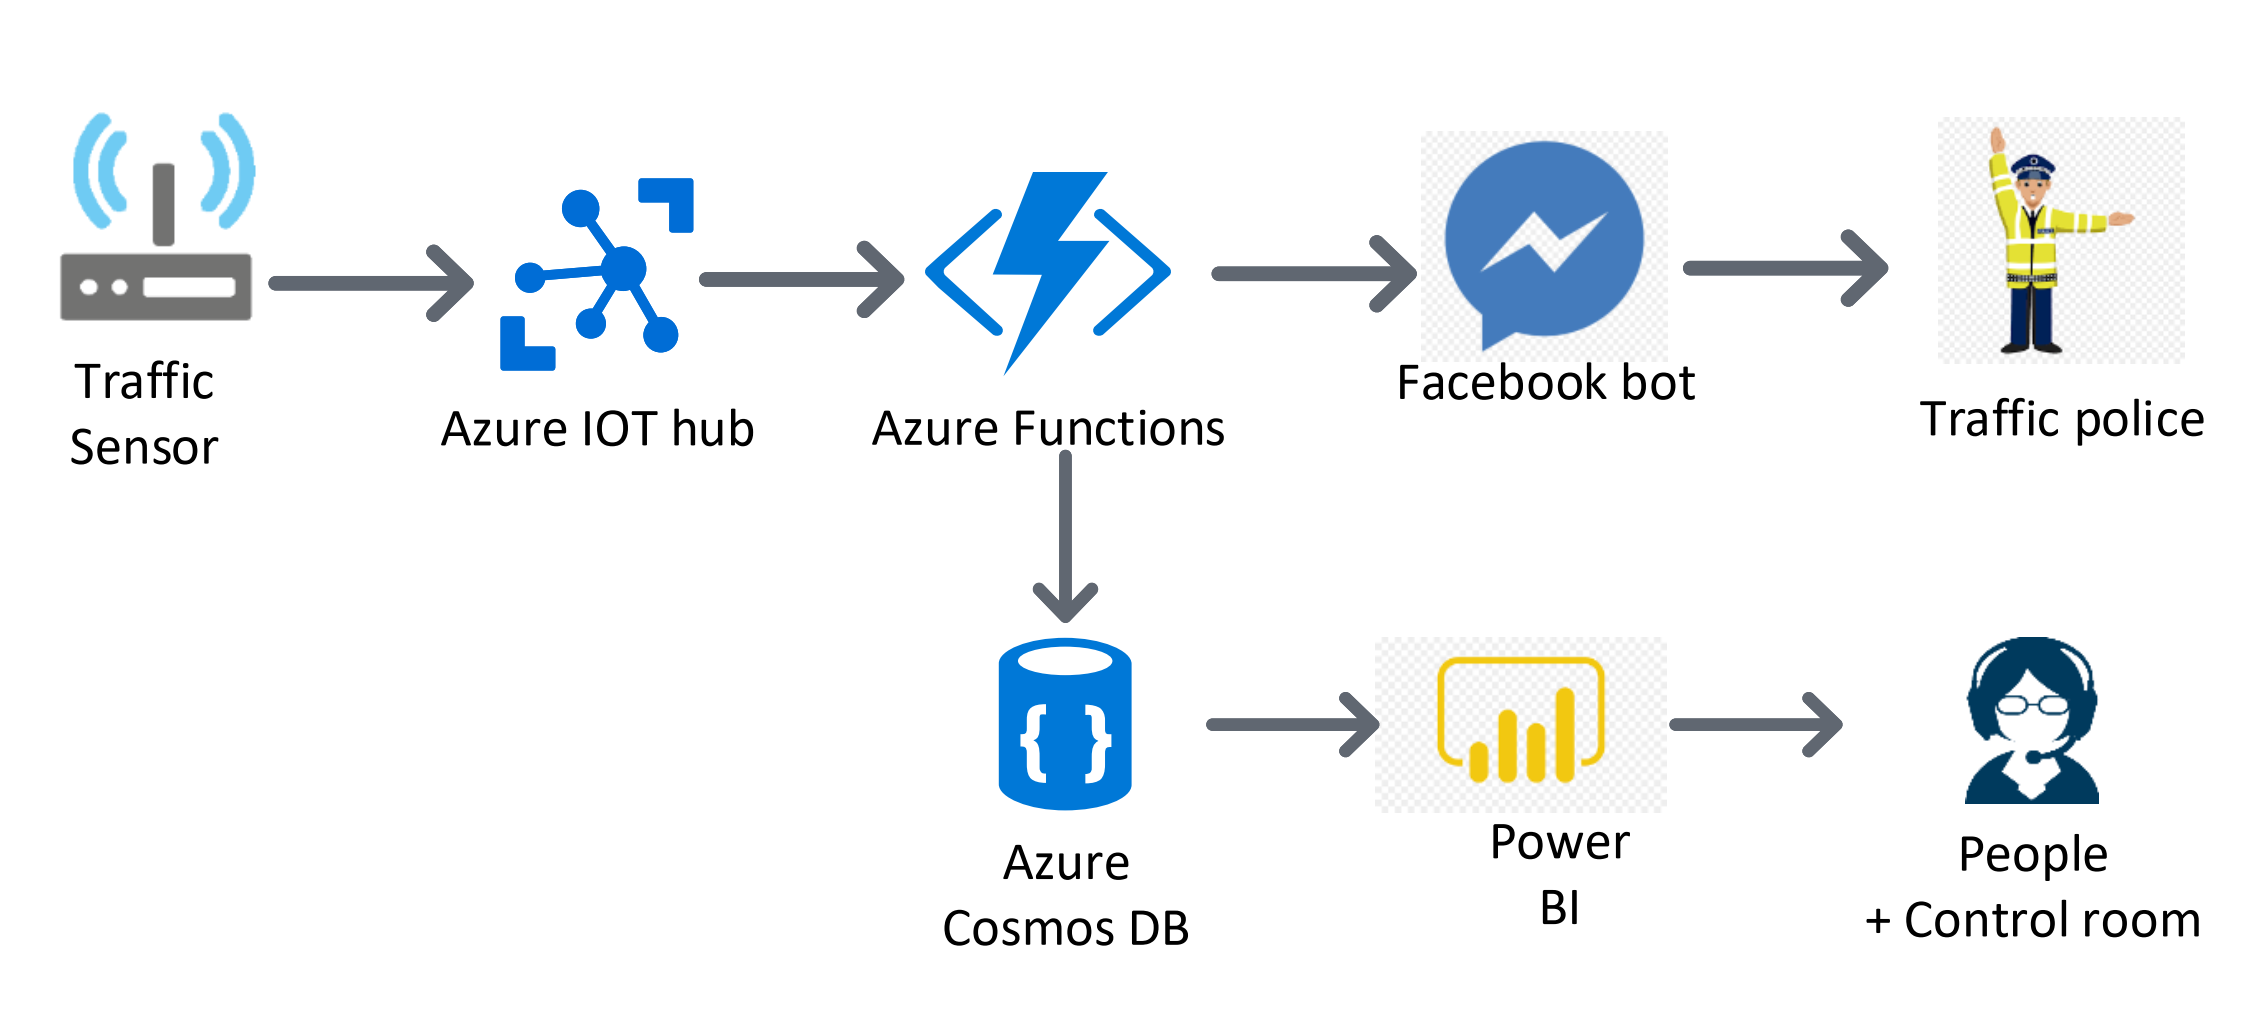
Architecture
Architecture of the solution is very simple and it uses most of the Azure managed services that handle the infrastructure for you.Whenever a new tweet is posted Logic Apps receives and processes the tweet. Sentiment score of the tweet can be analyzed using the Cognitive service then Azure function is used here to detect the sentiment of the tweet and finally inserted as a row in the powerBI to visualize in the dashboard. You can also use SQL server/Cosmosdb to store the tweet data if you want to process it later.
How to build the application:
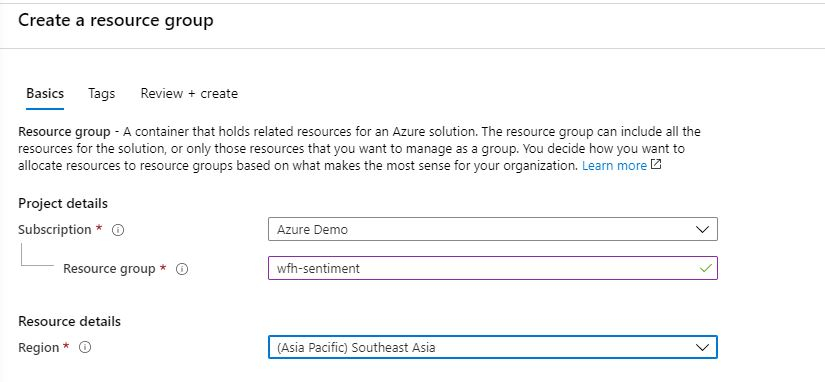
Step 1: Create the Resource Group
As the first step, we need to create the resource group that contains all the resources needed. Navigate to Azure Portal and create the resource group named "wfh-sentiment"
Step 2 : Create the Function App
As the next step lets create the Function App which we need to detect the sentiment of the tweet. You can create and deploy the function app using Visual Studio Code. Open Visual Studio Code(Make sure you have already installed the VSCode with the function core tools and extension). Select Ctrl + Shif + P to create a new Function Project and select the language as C# ( But you could consider using any of the language that you are familiar with)

Create new Function App

Select language as C#

Select the trigger as HttpTrigger

Give the name of the Function

Provide the name of the function
and the logic of the Function app is as follows,
using System;
using System.IO;
using System.Threading.Tasks;
using Microsoft.AspNetCore.Mvc;
using Microsoft.Azure.WebJobs;
using Microsoft.Azure.WebJobs.Extensions.Http;
using Microsoft.AspNetCore.Http;
using Microsoft.Extensions.Logging;
using System.Net.Http;
namespace WorkFromHome
{
    public static class DecideSentinment
    {
        [FunctionName("DecideSentinment")]
        public static async Task<HttpResponseMessage> Run(
            [HttpTrigger(AuthorizationLevel.Anonymous, "get", "post", Route = null)] HttpRequestMessage req,
            ILogger log)
        {
            log.LogInformation("C# HTTP trigger function processed a request.");
             string Sentiment = "POSITIVE";
            //Getting the score from the Cognitive Service and determining the sentiment
             double score = await req.Content.ReadAsAsync<double>();
             if(score < 0.3){
                 Sentiment = "NEGATIVE";
             }
             else if(score < 0.6){
                 Sentiment = "NEUTRAL";
             }
             return req.CreateResponse(System.Net.HttpStatusCode.OK,Sentiment);
        }
    }
}
And the source code can be found here. Then , you can deploy the function App to Azure with simple command using Ctrl+Shift+P and deploy to Function App.
Step 3: Create the Azure Cognitive Service to determine the sentiment of the tweet text
As we discussed above, lets create the cognitive service to determine the sentiment score of the tweet. Go to the same resource group and search for cognitive service and create a new service as follows,

Create Cognitive Service
Step 4: Create Cosmosdb to store the data
In my application, i have made this step optional as i don't need to save the tweet data for historical analysis. But you can definitely use cosmosdb to store the tweets to process later. As how you created the Cognitive service create a new cosmosdb account and a database to store the data as follows,

Cosmosdb to store tweets data
Step 5: Create PowerBI dataset to visualize the data
Navigate to PowerBI portal and create a new dataset to visualize the data we collected as follows,

Create new Streaming Data set in the work space

Select API in the new streaming data set option

Configure the fields as above.
Step 6: Create the Logic App and configure the Flow
This is the core part of the application as we are going to link together the above component as one flow. You can connect these flows using designer as well as using YAML code. I will be using Designer to create the flow.
As denoted above the first step we need to add the twitter connector which you can pick from the available list of connector named "when a new tweet is posted"

Connector when new tweet is posted
You need to configure the search text which you want to get the tweets , in this case i am going to use the Hashtag "#WFH" and set the interval as 30 seconds.

Look for new tweets on every 30 seconds
The second step is to pass the tweet to Azure cognitive service to analyse the sentiment of the tweet and get the score as output

Select detect sentiment as the next step
You need to provide the key and the URL which could be obtained from the cognitive service you created above.

Configure the detect sentiment of the tweet with the input as the tweet text
The third step is to pass the score obtained above to Azure function which we already deployed to determine the sentiment of the tweet, select the azure function from the connector list as follows,

Select Azure Function which will display the functions already deployed to azure

Configure score from the Cognitive service as an input to the Azure function
Next step is to stream the data set to powerBI so that it will be readily available for the visualization. Select the below connector as next step

Configure Add rows to a dataset to insert data to PowerBI
We are almost done with the configuration, as the last step you need to map the data fields from the above steps to insert into the dataset and the final configuration looks as below.

Mapping the dataset with the outputs from the previous steps
Step 7: Visualize it in PowerBI
Now we have configured all the steps required in the logic app, navigate to PowerBI and select the data set from which you want to create the report/dashboard. In this case we will select the data set which we have already created as follows,

Select the dataset
Rest is yours, you can create lot of usual charts/visualizations according to the way you need. I have created four basic metrics to see how world reacts to "work from home"
- Indicate the total number of unique tweets
- Distribution of sentiments using a pie chart
- Table which displays all the data (user,location,sentiment,score and the tweet)
- Worldmap which shows how distribution of sentiments look like
and this is how my application/dashboard look like.

Final Dashboard with RealTime Tweets
As you can see the tweets and the sentiments are being inserted to the data set and most of the sentiments are being Positive(Looks green !!!). You can replicate the same architecture for your scenarios ( Brands/ Public opinion etc).
As you see some complex scenarios/problems can be easily sorted out with the help of serverless computing and that is the power of Azure. Cheers!
For those who are interested you can view the Live dashboard.